Earlier this year, U.S. Secretary of Transportation Pete Buttigieg made this tweet:

It shows a map of a fantasy high speed rail system connecting the major cities of the USA and even extending into Canada and Mexico.
While true HSR (250km/hr+) has long been considered a pipe dream in the USA and North America as a whole, I wanted to find out which of these lines would be the most feasible.
In order for HSR to be feasible in North America, the cities must be in the so-called "Goldilocks zone" where neither flying nor driving make sense (time-wise and cost-wise), as seen in the graphic below:

So going back to Secretary Buttigieg's map for second:

This map bears the question: is it really worth it to connect Portland, OR and Sacramento, CA? The continent's 33rd and 37th most populous metros respectively, with a sparsely populated distance of 580 miles (933 km) between them as the crow flies. What about Denver and Albuquerque? In order to answer this we need a way of determining the "feasibility" of these routes.
In the case of train routes, feasibility boils down to 3 main factors: geography, economics and public perception.
Geographic feasibility will depend on whether cities are in the goldilocks zone (people will probably still fly from NYC-LA after HSR), but also geographic obstacles (mountains, seas, lakes), climate, tectonics and soil conditions.

The Glacial Express, Switzerland
Economic feasibility is based on demand, which itself will be a factor of ticket price, trip time, and train quality among other things. Recouping the cost of construction over a certain period of time is important to investors (and taxpayers), not to mention the continuous cost of maintenance and operations. If it's government-built like California's HSR project, will operations be subsidized? If it's privately operated like Florida's Brightline or Texas Central, will it be competitive with existing modes? Will it be abandoned if it's not profitable?

Private Operator Brightline's line in South Florida, is not considered true HSR by the 250+kmh definition.
The third metric of feasibility is public perception. Creating fast and reliable ways to travel within and between cities creates a more equitable and environmentally responsible society. If HSR is executed efficiently, exposure to fast trains could create a positive feedback loop of public perception and funding for network expansion. This is why determining the priority list of HSR line feasibility is not a futile exercise. It essentially represents a list of "safest bets" in terms of the cost-benefit ratio, and will serve to get the snowball of public perception rolling, which in turn increases demand and therefore economic feasibility.
The Gravity Model
So I will be focusing on predicting demand, and there are no shortage of factors used to predict demand. These are complicated further in the transportation sector due to the phenomenon of induced demand. But my approach here is to use a "Gravity Equation":
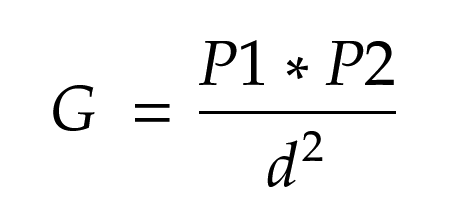
Where P1 and P2 are the populations of each city (metro area) and d is the distance between them. Essentially the bigger two cities are and the closer together, the more "demand" for travel between them. I like this approach because it provides a good heuristic for people in proximity. Of course, there are other variables I could use in the gravity equation such as a city's GDP. And there are other ways to forecast demand entirely such as looking at existing highway traffic or flight frequencies. But the Gravity equation will suffice for my purposes in this analysis.
Next, I found the Wikipedia lists of the most populous metropolitan areas in the USA, Canada and Mexico. I used the 2020 population data, and with a cut-off of 1 Million people, we get a total of 79 Metropolitan areas. Here's the first 20:

Reading this into a Pandas dataframe and using Geopy to get city coordinates and we can plot cities with radius proportional to population:

Now I calculate each city's G value relative to every other city to get a sense of the highest gravity routes. Before we look at the results, I wanted to use the same gravity formula on some routes outside North America to benchmark against:

The green bars are routes that currently have existing high speed rail service, and the red bars do not. I'm using Madrid - Barcelona as a benchmark here because they are two cities of roughly the same size in the goldilocks zone of distance (ie. too far to drive, too close to fly). This allows us to put our G values in context of "Madrid-Barcelona Gravitational Units" (MBGUs): for example we can say that the London-Paris route has an MBGU of 10.85, meaning it has around 10x the gravity of Madrid-Barcelona, while Sydney-Melbourne only has around 27% percent. The specific conversion is: 1 MBGU = 132,814,533 P² / km²
Now let's take a look at how the North American routes did:

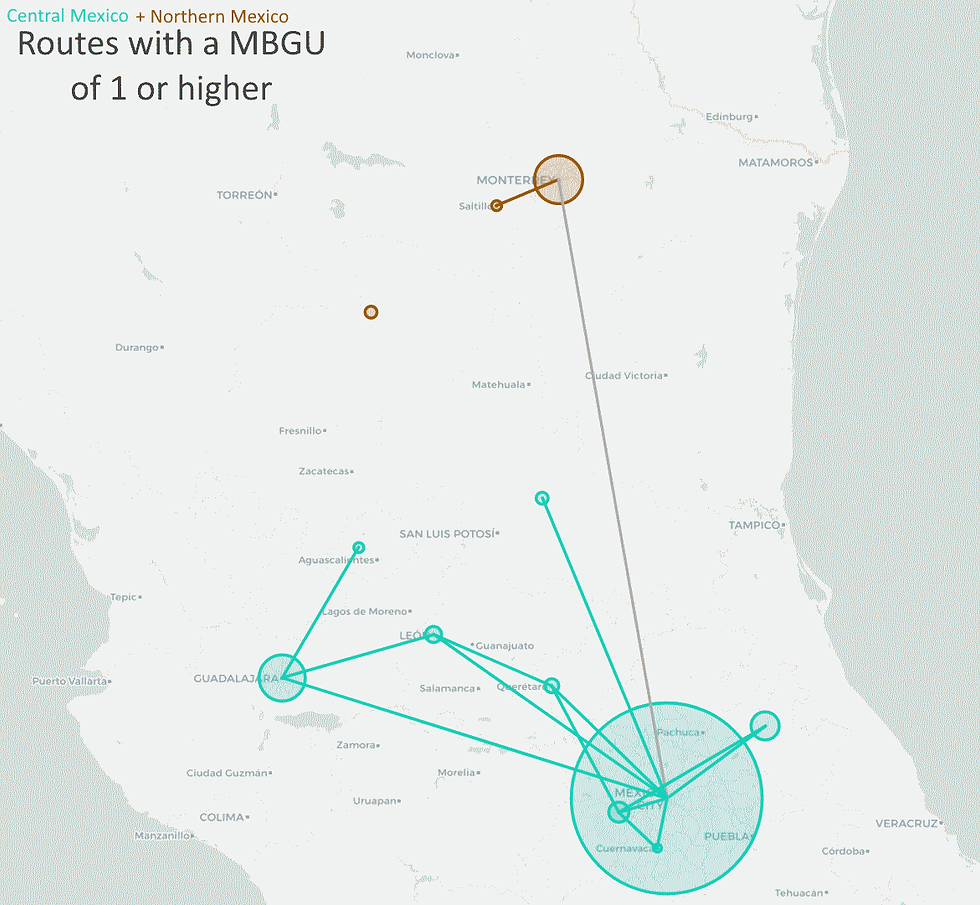
In total, there are 81 North American routes with a G-value equal to or higher than Madrid-Barcelona. We can see the massive gravity between Mexico City and Toluca, the 5th most populous metro in Mexico, just 63km from Mexico City. We can also see various high gravity routes in Southern California and the Northeast. Here is an overall map of the routes with a MBGU higher than 1 (ie. a G-value higher than the Madrid-Barcelona route):

Megaregions and Corridors
The above lines and bars are coloured by "megaregion", or proximal groups of metro areas roughly corresponding to cultural—economic—geographic regions.
Below is a map of these megaregions:

Let's put in context the combined gravities of these megaregions:

We can see that Central Mexico dominates this metric because the massive Mexico City (21.8 M) generates a lot of gravity with the medium-sized cities in the surrounding region, especially the route between Mexico City and Toluca, which accounts for around half of this region's total gravity:
In addition to megaregions, I wanted to see how the combined gravity of established and under construction rail corridors stacked up:

Despite Buttigieg's map depicting cross-border rail lines, it remains to be seen if these international routes could have seamless integration into the national networks. Here are the highest gravity cross-border routes:

Individual Cities - Determining Future Rail Hubs
In addition to geographic location and population, a metric that would be useful in determining good future passenger rail hubs is the "gravity share", or the distribution of gravity that a city has with other cities:

Cities with more even distributions indicate that possible destinations are roughly equidistant, or it indicates a gradient where larger cities exist in a farther range, making them good regional hubs. These include cities like Chicago, Miami, Atlanta and Dallas as seen in the pie charts above, where no one city comprises more than a quarter share of the gravity with that city.
Gravity sum per capita is another interesting metric that allows us to visualize the correlation between a city's population and its total gravity:

One last metric I wanted to visualize is the median gravity of a city. Along with gravity share, this metric is also useful in determining future rail hubs as it removes high gravity outliers (like Toluca's route to Mexico City) where one single route can skew the overall importance of a city. Let's take a look:

Median gravity has an even stronger correlation with population than sum gravity:

Examining Specific Routes
Here are some handpicked routes and their closest international gravity comparison. It may or may not surprise you how these stack up:
Route | MBGU | International Equivalent |
Sacramento, CA - Portland, OR | 0.08 | Zurich - Rome |
Edmonton, AB - Calgary, AB | 0.22 | Berlin - Brussels |
Toronto, ON - Montreal, QC | 0.84 | Valencia - Barcelona |
Boston, MA - Montreal, QC | 1.00 | Madrid - Barcelona |
Dallas, TX - Houston, TX | 3.14 | Naples - Rome |
New York, NY - Boston, MA | 7.97 | Shanghai - Seoul (undersea) |
New York, NY - Washington, D.C. | 8.96 | Bangalore - Chennai |
Downsides of the Gravity Model
One thing the gravity model does poorly is accounting for what we might call 'directional gravity'. To illustrate this, let's take a look at the MBGU for the San Francisco - Los Angeles Route:

Compared to the gravity we get when we use the megaregions:

And the same but using San Jose as the Northern California Hub:

And lastly the combined gravity of connecting all of Northern California and Southern California (with direct connections between every city) is 195.02.
So while the gravity model only rates the SF-LA route as around 50% greater than Madrid-Barcelona, the true 'directional gravity' (ie. people using the hub train station to travel between megaregions) is likely much higher, especially if we also factor in people traveling from the Pacific Northwest to points in California.
Another obvious downside of this model is that it uses straight lines between cities, and as mentioned earlier, geography is a key factor in determining rail viability. Routes which in reality need to travel around large bodies of water or mountains are being "over-rated" in the Gravity model:

One way to remedy this would be to use driving route distances rather than euclidean distances, which would be a better indication of actual rail routes and lengths. In addition to this, the model is probably "under-rating" certain routes that would have high tourist value and therefore more ridership than indicated by their metro populations such as Los Angeles-Las Vegas or Miami-Orlando.
One last important limitation is that I have only used cities with a metropolitan population greater than 1 million, potentially missing out on some key cities that could be crucial in connecting the rail system across the continent. Buttigieg's map does not appear to use population as the only determining metric for if a city gets a HSR stop. If multiple cities can be lined up in a viable corridor, it may make more sense to connect them in those lines rather than going solely off the gravity model. Additionally, trade-offs need to be made for which cities are important enough to get a stop, because a route with more stops slows the overall trip time, and HSR needs to minimize those less valuable stops in order to be competitive with flying. Metro areas should focus on building good regional transit access to their high speed rail stations, which should be reasonably spaced out for maximum demand.
Conclusion
The gravity model is not perfect, but it can provide a priority list for which HSR routes to build out in what order. One cool way to illustrate this is this is a GIF where we slowly decrease the "threshold" gravity to see the HSR network expanding throughout North America:

High speed rail in North America is still a while away, and building out a full network will take decades, but with the new infrastructure bill, and numerous private and government organizations across North America looking at or currently building fast trains, it's time we all get aboard.
Check out the full list of routes in my analysis here:
And here is the Jupyter Notebook containing my code:
Or you can view it on GitHub here.
Comments